Road testing Google's NotebookLM
Or when will the human analyst go obsolete?
Over the weekend, I road-tested Google’s latest and greatest AI data exploration tool, trying to determine whether we really have our robot assistant researcher yet.
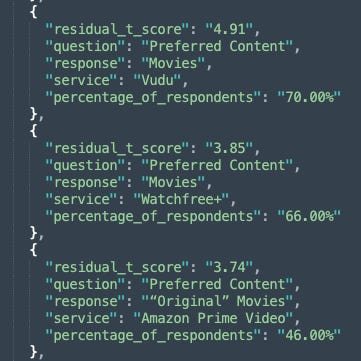
I used the fifth and most recent wave of MX8 Labs’ ongoing study on streaming behavior to work with. NotebookLM can only take limited file formats, so I gave it two text files. The first contains the Python survey code, and the second is a JSON document highlighting the statistically significant results based on the residual value from cross-tabulating all variables against each other.
The survey code looks like this:
And the statistically significant results look like this:
Let’s go podcasting!
Notebook LM is most famous for its auto-podcast function; you can hear the output here.
So, what do I think of the results?
Firstly, it’s hugely compelling to listen to and even made me laugh. It picks out some relevant statistics and brings them to life. The downside is it brings them to life with data points that aren’t in the data. It talks about antenna as being an old thing, but even ChatGPT knows about the OTA resurgence:
I think it’s using external data to try to make the data relatable, and while that’s admirable, I’m not sure it’s choosing the correct hypothesis. It concludes that streaming needs to be more personalized, which isn’t even a topic that was covered in the survey.
More traditional summarisation
I also got it to try a more traditional summarisation approach, which was much better for that. Here’s an extract of what it gave me as a “briefing note”:
Ad Awareness and Acceptance:
High awareness of ad-free tiers: Most respondents (80-90%) were aware of ad-free tiers for services like Netflix, Paramount Plus, and Peacock.
Cost-effectiveness drives ad-supported tier adoption: A key factor in choosing ad-supported tiers across various services was "Cost-effectiveness (lower subscription fees or free tier)".
Value perception outweighs ad inconvenience: Many respondents felt that "Value (access to a variety of content, outweighs the inconvenience of occasional ads)", particularly for services like Hulu and YouTube.
Ad Experience and Preferences:
Varied ad experiences across platforms: While some services received praise for "Just right" ad break lengths (e.g., Netflix: "69.00%," Paramount Plus: "67.00%," Tubi: "60.00%"), others were criticised for repetitive or annoying ad breaks.
High ad skipping likelihood on some services: Platforms like Pluto TV, Samsung TV Plus, The Roku Channel, and Tubi saw a significant percentage of respondents ("46.00%" to "51.00%") indicating they "Always" skip ads when possible.
Pause ads remain largely unnoticed: The majority of respondents (69.00% to 92.00%) across various services, including Tubi, Pluto TV, and Netflix, were unaware of pause ads.
Here, it stuck closely to the facts and summarised them well, with results comparable to ChatGPT, but not significantly better.
Asking questions
NotebookLM shone in answering questions. To the question “From this data, how can I help drive OTA viewing and ATSC3.0?” it provided significantly better results than ChatGPT. The coolest feature was that every single data point was referenced with a number you could click on to see the source:
So what next…?
Google describes NotebookLM as being in Beta, and I’d say it’s a pretty good beta. The audio feature is really just gimmickware, but the data querying feature is great. I’d recommend any platforms producing data work out a simple way to export data from their platforms into NotebookLM so that users can leverage this type of functionality in the future.
UPDATE #1: 27th October 2024
Google has now provided an additional prompt for the podcast generation, and I tested it with a focus on a B2B audience, especially those running streaming platforms. The result is excellent, but it continues to bring in outside information. It feels more like a panel at a conference than a presentation of survey results.
You can listen here:


